Mission Report · MapMyIndia [Gtropy]Project case study
Locate — Manufacturer Backend
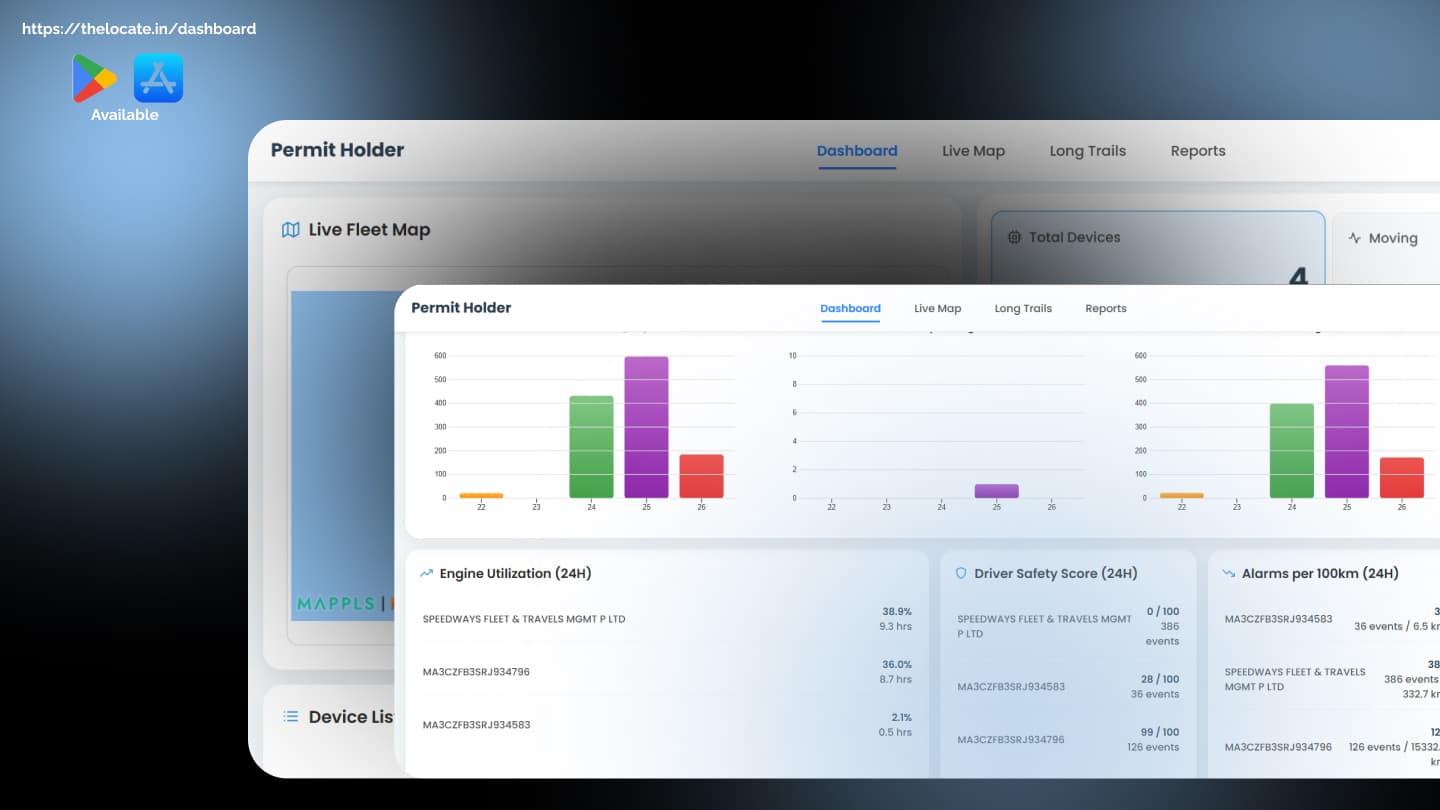
Twenty thousand vehicles across one state, watched from both a desk and a phone. The two screens needed the same truth, not the same layout.
- Status
- Shipped
- Owned
- Frontend lead (independent)
- Vehicles
- 20,000+
- Coverage
- Maharashtra
- Stack
- React
- TypeScript
- Mappls SDK
ResultsMeasured
- 20,000+
- Vehicles monitored · Across Maharashtra
- 20,000+ vehicles monitored
I decided
- Frontend direction, independently
I built
- Real-time vehicle monitoring; web and mobile dashboards
Real-time vehicle monitoring for an OEM, on web and mobile dashboards.
A vehicle manufacturer wanted to see its fleet in the field: live location, engine health, journeys, driver behaviour and driver test scores, across 20,000+ vehicles in Maharashtra, from a desk and from a phone.
Manufacturer operations teams monitoring 20,000+ vehicles across Maharashtra.
The web and mobile dashboards had different jobs. The desk wanted analysis: trends, comparisons, driver scoring. The phone wanted a quick answer about one vehicle. Same data, different questions.
Give both surfaces the same truth without giving them the same layout, and keep everything responsive as live telemetry streams in.
If global state is managed once and every view reads from it, web and mobile stay consistent by construction rather than by discipline.
React with the Context API as the single state layer, D3.js for the custom visualisations the analytics required, Mappls SDK for the map, and a unified UI system across web and mobile.
Live tracking and engine metrics first, because that is the daily use. Journey reports and driver scoring next. The visual polish of the analytics last.
Dashboards that lead with the current state of the fleet, drill into a vehicle, and only then into charts. Driver scoring presented as something a manager can act on, not a number on its own.
Custom D3 visualisations for performance, route and behaviour patterns, on a responsive layout that reorganises rather than shrinks between desktop and mobile.
Web and mobile dashboards over real-time vehicle telemetry.
Ali independently led the frontend.
Live on the Google Play Store and Apple App Store, supporting 20,000+ vehicles across Maharashtra.
Leading the frontend alone meant owning the questions, not just the screens. The most useful thing I did was ask what each dashboard was for before deciding what went on it.